There are many situations where you want to connect to a Node.js instance running on a remote server. Currently, I have a RaspberryPi running with input from a light sensor. It’s very helpful when debugging, to be able to step through the code running on the hardware directly.
The RaspberryPi is already on my local network. I connect to the device over ssh and start the app, then step through the code on my local machine using DevTools.
Bind Ports Over SSH
When you connect to the remote session the key is to leverage the -L flag. This will take in a few arguments:
{port}:{host}:{hostport}
Our ssh connection now looks more like this:
ssh -L 9229:localhost:9229 pi@1.1.1.1
We are saying that we want ssh configured specifically to bind any traffic on the remote session sent on port ‘9229’ to my local system’s port ‘9229’. After that we just have our standard ssh parameters where ‘pi’ is the username and ‘1.1.1.1’ is the ip address for the remote connection.
V8 Inspector Integration
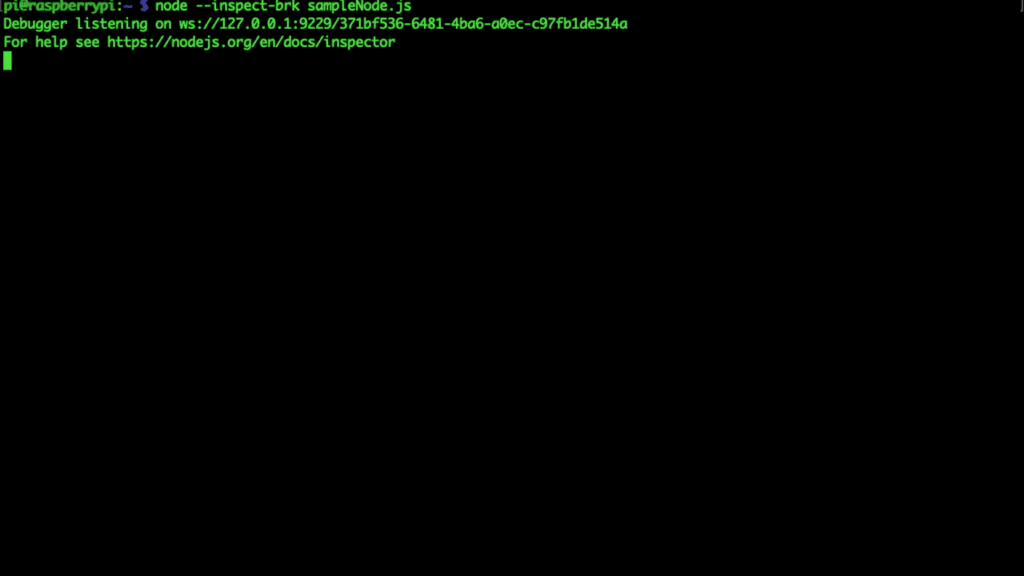
When I run Node.js using the –inspect, or –inspect-brk flags, this will enable the built in debugging utilities included with V8 and allow you to connect to a specific instance of Node.js to inspect, debug, and profile. By default, this debugger runs on port 9229 but this can be customized by passing in an override value to the inspect flag ex: inspect-brk=9230.
The way that this works under the hood is that it uses the Chrome DevTools protocol that ships with Chromium. Checkout their API, and stay tuned to hear more about how we can use this to automate tasks like profiling, or checking for memory leaks, using chromium and devTools.
Remote Debugging Example
$ ssh -L 9229:localhost:9229 pi@154.222.12.111
$ node inspect myscript.js
Debugger listening on ws://127.0.0.1:9229/7e8d56bc-8a7e-4fe9-b958-e7805f26bae4
For help, see: https://nodejs.org/en/docs/inspector